.svg)


App-Level eBPF Applications - User vs. Kernel Probes

Throughput - you can buy.
Latency - you need to architect for.
When running the diversity of applications required today to power our many tools and platforms, the need for more granular application-level visibility, has become critical for many engineering teams. eBPF has come into play to deliver significant expansion of the traditional BPF capabilities, eBPF extends the use of BPF to allow more than just network packet processing. eBPF has transformed into a versatile framework that can run sandboxed programs in the kernel, providing a safe way to extend the capabilities of the kernel without modifying its code or adding kernel modules.
eBPF programs can access application context (including managed runtime, that is not limited to native libraries), and allow developers to attach eBPF programs to various hooks within the Linux kernel. This enables the monitoring of system calls, network events, and even application-specific behavior without the need for traditional, heavy-weight instrumentation that also imposes a risk to the application’s stability. This capability can be leveraged to analyze application performance, monitor for security threats, and understand system behavior in real-time, all with minimal overhead and secure by design thank’s to the eBPF Verifier. In this post, we’ll examine the two most popular methods for implementing eBPF instrumentation to gain application context in the runtime, by using user-space and kernel probes - and understand how each impacts the application performance and compute cost.
Where eBPF Meets Your Applications
eBPF technology was formerly utilized primarily for visibility and performance engineering, and also for networking purposes (such as packet filtering and network traffic analysis using XDP). But eBPF also provides developers with a powerful way to collect data on the applications (down to the function execution level), with minimal latency.
Depending on the desired level of visibility, eBPF can be leveraged to have a greater understanding on:
- Processing, Networking, IO & File System Syscalls: Where developers can infer what the system is doing roughly but lacks a full understanding of the characteristics of the application, and cannot distinguish whether a syscall originated in a third-party component (such as an open source library) or our own code. The granularity in this case is the process and the syscall it invokes through time, without specific line number or function name that caused this syscall.
- Full Application Context: Enabling developers to understand everything that is happening inside applications down to the function level.
The granularity in this case is down to the function level, and library behavior within our application.
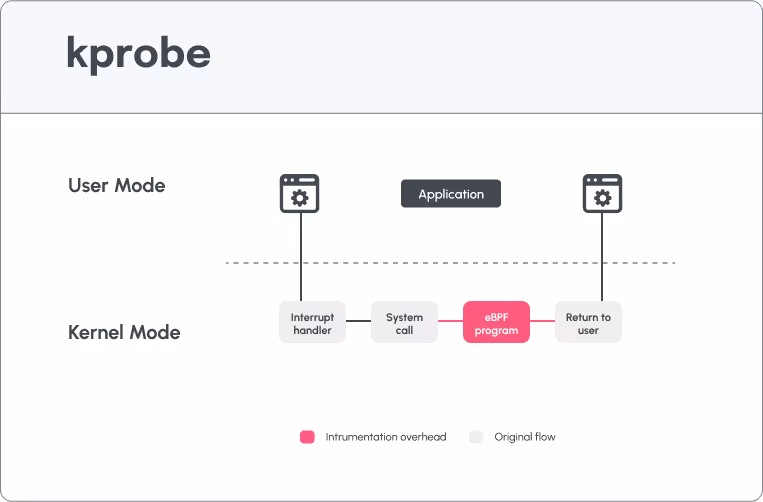
The chosen method of instrumentation to date has been kernel probes for the first level of visibility, and user probes for deeper visibility of application level behavior. However, the user probe instrumentation comes with its own set of unique challenges that directly impact performance and cost. Some may argue they are not suitable for production at all.
The Challenges with User Probes for eBPF Visibility
If we take a look at the benchmarks and numbers, we can see a significant performance degradation when it comes to implementing user probes for application-level visibility. In this benchmark you can see the performance gains for file system, networking, and application monitoring when leveraging kernel probes vs. user probes.

The reason user probes are the more popular method for application visibility is because the kernel remains frightening to many developers, and there is often a greater understanding of the user space than the linux kernel, when it comes to the most popular programming languages from Python, to Javascript to Golang. A user-space probe enables integrating eBPF programs with user-space code, for the price of additional context switch. If you are willing to bear the cost of an additional context switch, which hurts performance (as demonstrated in the figure above), you will be able to gain visibility in almost any piece of code, where you need it the most.This, however, is the exact gotcha.
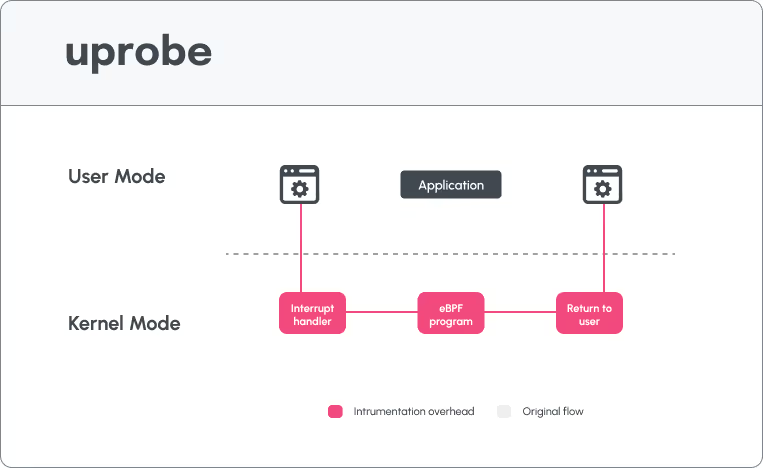
These probes are not suitable for all types of application, and they really hurt performance in some use cases - we have seen 200% increase over the same kprobes implementation.
This is particularly true at scale and intensive workloads, and can be explained by the additional context switches and longer chain of events of uprobes (compared to kprobes).
When it comes to I/O heavy applications, you repeat the same operations many times a second or minute, depending on the executed function. This means that depending on the level of visibility required, whether on a function level, or tracing and profiling: line by line executions come with a very high cost from an application performance perspective. This is due to the manner in which these probes work, by requiring additional context switches on every event.
Kernel Probe Implementation
While we understand the limitations of user probe eBPF implementations for application level visibility, the question remains how to achieve greater visibility when leveraging kernel probes instrumentation? To date, this implementation solely receives values and addresses in real memory, however they weren’t really able to access application-level data until now.
Until Oligo.
Oligo has achieved what was previously only possible using user probes and USDT (User Statically Defined Tracing) without the operational burden of context switches. This unique implementation does not require developers to change the way they work, and also won’t impact CI/CD pipelines or runtime performance. We have invested much of our research and development in achieving the same app-level visibility, without the performance overhead.
This approach shines in environments with managed runtimes, such as Python, JavaScript, Go, Java, PHP, and Ruby, where traditional kernel probes usually do not read the virtual memory used by these languages, becasue they manage their own stack memory in user space - they include Just In Time Compilers (JAVA), Interpreter (Python, PHP, Ruby, and more). However, this is less of an issue for native languages that compile to Assembly code - because their stack memory is directly accessible, as is, to the BPF programs.
Making the Right Choice for eBPF Application-Level Visibility
Choosing between user space and kernel space probes for eBPF instrumentation comes down to balancing visibility and performance. While user space probes offer deeper insights into application-level behavior, they come with a significant performance cost, often making them unsuitable for production environments. On the other hand, kernel space probes provide a more efficient solution with less impact on system performance but may lack the detailed visibility required for certain use cases. You can access the memory, but you don’t have a clue of what’s inside - like Chaos.
At Oligo, our research has enabled a novel approach to application-level visibility, by leveraging kernel probes, it is now possible to achieve the best of both worlds: comprehensive insights without the performance overhead that typically comes with user-space probes. This approach allows engineering teams to maintain high performance and efficiency across systems while still gaining the necessary visibility into applications.
When considering eBPF for application-level monitoring, it’s essential to weigh the trade-offs between the probes we use and hook inside our eBPF programs. For production environments where performance is critical, kernel space probes offer a practical and efficient solution. However, for scenarios requiring deeper application insights, user space probes may still be necessary, albeit with caution regarding their performance impact. By understanding these trade-offs and leveraging the right tools, engineering teams can optimize both visibility and performance of their applications in real time.